Charts and Diagrams are some of the most widely used tools by professionals around the world.
Unlike plain 2-D data sheets, charts and diagrams display the valued attributes in form of bars, graphs, doughnuts, or pies. Thus, making the underlying data easier to understand and work on.
But, what happens when you push the versatility of Graphs and Diagrams even further?
You get Pivot Tables.
Today, in this article we have brought along with us a tutorial on how you can create captivating and useful pivot tables in Numbers via your iPhone or iPad.
Thus, without further ado.
Let us Begin…
What are Pivot Tables?
Pivot Tables are 2-dimensional representations of data of a flat surface with the help of various line graphs.

Pivot Tables are capable of displaying huge data values at a single go and their representation mechanism uses line graphs to show the path of each value in a given time-space.
Why is pivot tabes better for analyzing data over graphs and diagrams?
If you think carefully, even pivot tables are a form of graph and diagram. They work on a 2-D surface, they show the final value in a 2-D form and they also use basic line graphic techniques to visualize the life of a value.
But, the major difference between a pivot table is- It can synthesize a humongous amount of data at one go.

For a pivot table, there is no limit on how many values you can use. Plus, the line graphing technique used in pivot tables often helps users to figure out patterns and trends among the input data.
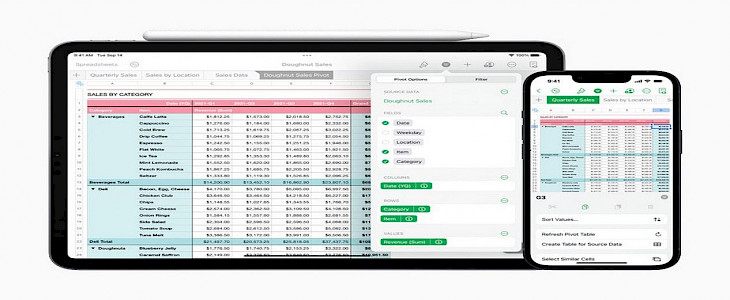
Creating Pivot Tables in Numbers

- On your, iPhone open the Numbers app.
- Now you can add a whole table containing source data with the “add” option located on the top-left corner. (This source data can be uploaded from wither the cloud-drive or the device)
- When the table is open, select the tables that contain your source data.
- Look for the Table-actions button located on the bottom-right corner of the screen, click on it.
- In the table-action button, you will see” Create Pivot-Table”, click on it.
- A new screen will appear.

- On the new screen, you will see a dialogue box showcasing “Pivot options”, click on the pivot options link.
- Now under pivot options select the fields you would like to include your pivot tables.

- Once you have selected wanted fields you can now rearrange the fields by simply dragging and dropping them over one another.
- Now to set how the mode of result, click on the “info” button and select the wanted unit.
- When everything is set, you can simply tap anywhere outside the menu to close it and within a few seconds, your pivot table will be ready to use.
Note: Under normal circumstances, the pivot table will come out as an excel sheet to visualize it you can use the “create graph” button.
Winding Up
And just like that, you can create Pivot Tables via your iPhone or iPad.
Hope you liked the article. We will be back soon with more intuitive tutorials. Until then stay tuned and have a Good Day!